
Listen to this Blog:
Part IV of a Series on CQAs & CPPs
Since 2011, clinical translation centers and biotech companies in more than 60 countries have posted over 1,500 clinical trials to investigate the use of human mesenchymal stem/stromal cells (hMSCs) for regenerative medicine. Nevertheless, there remains a critical need for economical biomanufacturing processes able to generate billions to trillions of cells per manufacturing lot to support the demand of future commercial applications [1]. Conventional large-scale hMSC manufacturing involves two-dimensional (2D) monolayer cell expansion in multi-layer vessels; however, scaling this bioprocess presents labor and cost challenges [2].
In a previous RoosterBio Blog, Building Effective Multi-Year Process Development Programs: Evolution of Technology Platform Decisions Based on Lot Size, Dr. Lembong and Dr. Rowley considered how three-dimensional (3D) microcarrier suspension bioreactor systems provide a promising alternative method to scale-up hMSC production [3]. As the hMSC manufacturing process is scaled from 2D to 3D bioreactor culture, it is imperative to maintain comparable critical quality attributes (CQAs) to reduce risks of costly failures of mid-to-late Phase trials, which Dr. Mark F. Witcher discussed in “Why Controlling CQAs Isn’t Good Enough For Cell & Gene Therapies” [4]. In our preceding blog posts [5, 6, 7], we assessed hMSC CQAs (i.e., adherence to plastic, cell surface marker expression, trilineage differentiation) and cellular functional attributes (i.e., expansion potential, angiogenic cytokine secretion, immunomodulatory activity) against the critical process parameters (CPPs) we use to control for them. In this post, we return to discuss CPPs that may be utilized to control for CQAs in 3D bioreactor systems. In addition, we note the comparability of CQAs and functional attributes between hMSCs manufactured in 2D planar culture vs. 3D bioreactor culture.
CPPs Specific to Bioreactor Process
In the previous blog post, Identify & Define Your Cell Therapy’s Biomanufacturing Approach for Critical Process Parameters (CPPs), we discussed our approaches to identify and define CPPs, and presented examples for 3D bioreactor culture, including cell hMSC inputs (i.e., cell seeding density) and raw material attributes (i.e., media, growth factor concentration). Here below, we’ll further explore three crucial operation parameters: (1) bioreactor agitation rate, (2) dissolved oxygen (DO) concentration, and (3) pH control. These metrics were previously optimized in small-scale benchtop bioreactors (0.1 L) and scaled up to production bioreactors (50 L) [8].
(1) Agitation Rate
Agitation enables a uniform distribution of nutrients in bioreactor culture and prevents formation of large aggregates of cells and microcarriers that may impact homogeneity of the cell population. However, agitation introduces shear stress into the bioreactor culture environment and may knock attached cells off microcarriers, which may even lead to premature differentiation of cells. Fortunately, agitation may be controlled to enable a homogenous suspension without harming cell viability [9] by control of power supply provided to the mechanism of agitation (i.e., impeller). An example of an agitation stir speed profile in a 50L bioreactor process is displayed in Figure 1, where the agitation is maintained at 8 RPM through the first 72 hours and then raised to 9.5 RPM. An increase in agitation rate during the culture is needed to prevent formation of large cell/microcarrier aggregates, especially after performing a feed that may stimulate cell growth. This is critical since cell viability in hMSC aggregates has been shown to decrease as aggregate size increases due to limited nutrient transfer to the cells in the center of the aggregates [10, 11]. Therefore, for optimal cell yield inside the bioreactor, aggregate size needs to remain small enough to maintain cell health during bioreactor expansion.
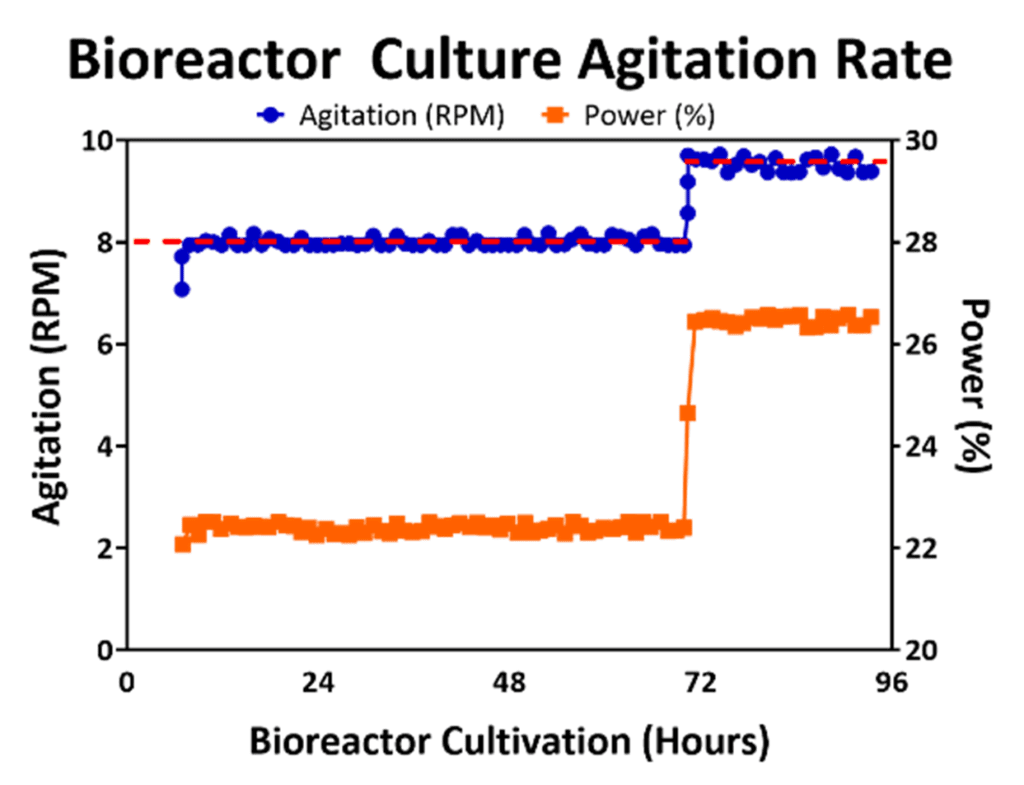 Figure 1: Bioreactor agitation (blue line) was maintained at the set point (red line) by adjusting the amount of power (orange line) during culture. Increase in speed was performed to prevent large aggregation after Day 3 of culture.
(2) Dissolved Oxygen (DO) Concentration
DO promotes cell expansion in both 2D planar culture and 3D bioreactor culture where O2 is exchanged at the media to air interface. In 2D monolayer culture, cells sit beneath the surface facilitating O2 exchange, but in a 3D bioreactor culture, cells are dispersed through the bioreactor. Therefore, it is necessary to monitor the DO concentration to prevent inhibitory levels of DO [12] by controlling the flowrate of O2 into the bioreactor to maintain DO levels to support cell growth. An example DO concentration profile for a 50L bioreactor run is represented below in Figure 2, where the DO level was maintained near the 100% setpoint throughout the bioreactor expansion. As the cell density increased in the bioreactor, the consumption of O2 increased and the flowrate of O2 into the bioreactor also commensurately increased.
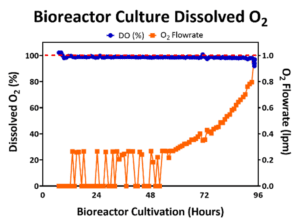 Figure 2: Bioreactor DO (blue line) was maintained at 100% (red line) by controlling the O2 flowrate (orange line).
(3) pH Level
The optimal pH level to maintain hMSC viability and to maximize cell yield is between 7.0 and 7.5. In 2D planar culture, cells are cultured in growth media that is buffered and are expanded within incubators with 5% CO2 in the headspace gas to help maintain the pH within the desired range. In turn, the flowrate of CO2 into the 3D bioreactor may be controlled to maintain 5% CO2 in the headspace to mimic the atmospheric conditions of the incubator and to also maintain the bioreactor pH level. An example pH profile for a 50L bioreactor culture is shown in Figure 3 where the pH is kept >7.0. Through the first 72 hours of bioreactor culture, the CO2 flowrate is controlled to maintain a 5% CO2 in the headspace; however, as the cells expand, metabolize, release lactic acid, and lower the pH level towards 7.0, the CO2 flowrate into the bioreactor headspace is reduced to prevent the pH level from falling below 7.0.
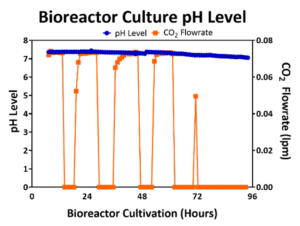 Figure 3: pH (blue line) was maintained above 7.0 by maintaining the CO2 flowrate (orange line) in the headspace.
Maintaining CQAs while Scaling up hMSC Manufacturing into 3D Bioreactor Cultures
Steady control of input process parameters like agitation rate, DO concentration, culture pH, and other features influence CQAs. In turn, some CQAs (e.g., cell metabolism-related) may circle back directly or indirectly to influence the CPPs. As a dynamic manufacturing process is scaled from 2D planar culture to 3D bioreactor culture, it is thus highly important that comparable cell CQAs are maintained—and that functionality remains intact—to minimize risks in mid-to-late Phase trials that would benefit from 3D. As shown in our example in Figure 4 (below), through routine control of CPPs we can demonstrate comparable hMSC surface marker expression, angiogenic cytokine secretion, immunomodulatory activity, and canonical trilineage differentiation between 3D bioreactor cells and 2D planar cells that were cultured in parallel and are of similar PDL.
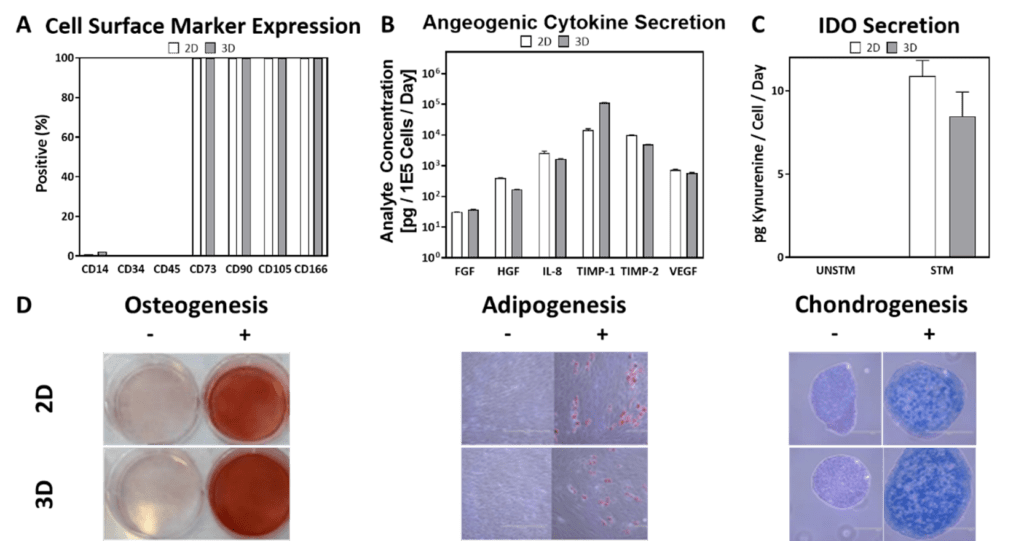
Figure 4: Comparable cell surface marker expression (A), cytokine secretion (B), IDO secretion (C), and trilineage differentiation (D) were observed among 2D and 3D cells of comparable PDL.
To meet the demand of future commercial cell and gene therapy applications that involve more than 20 or so patients, it is necessary to scale up biomanufacturing processes from 2D monolayer cell flasks to 3D bioreactor systems, such as those with microcarrier suspensions. While scaling up manufacturing processes, attention to CQA maintenance between 2D and 3D bioprocess formats is imperative to mitigate risks of costly mid-to-late Phase trial failures via non-comparable products that come from different processes. Encouragingly, RoosterBio has helped to trailblaze the successful scale-up via its paired cell and media platforms to seamlessly scale from 2D planar culture to 3D bioreactor culture without compromising CQAs. As hMSC biomanufacturing processes continue to evolve to meet demand, so may the CQAs and the CPPs that are utilized to control for them.
References:
- Olsen, T. R., Ng, K. S., Lock, L. T., Ahsan, T., & Rowley, J. A. (2018). Peak MSC-Are We There Yet?. Frontiers in medicine, 5, 178. https://doi.org/10.3389/fmed.2018.00178
- Mizukami, A., Swiech, K. (2018). Mesenchymal Stromal Cells: From Discovery to Manufacturing and Commercialization. Stem cells international. 4083921. https://doi.org/10.1155/2018/4083921
- Lembong J & Rowley J. Building Effective Multi-Year Process Development Programs II: Evolution of Technology Platform Decisions Based on Lot Size. https://www.roosterbio.com/blog/building-effective-multi-year-process-development-programs-ii-evolution-of-technology-platform-decisions-based-on-lot-size (2021). Accessed.
- Witcher, MF. Why Controlling CQAs Isn’t Good Enough for Gene & Cell Therapies. Cell & Gene 2020; Available from: https://bit.ly/2xBvCHj.
- Carson J. “Known Unknowns” Affect Critical Process Parameters & Critical Quality Attributes in the Bioproduction Cycle. https://www.roosterbio.com/blog/known-unknowns-affect-critical-process-parameters-critical-quality-attributes-in-the-bioproduction-cycle (2021). Accessed.
- Adlerz K. Critical Quality Attributes (CQAs): Know Their Importance & Limitations in Product & Process Development. https://www.roosterbio.com/blog/critical-quality-attributes-cqas-know-their-importance-limitations-in-product-process-development (2021). Accessed.
- Lembong J. Identify & Define Your Cell Therapy’s Biomanufacturing Approach for Critical Process Parameters (CPPs). https://www.roosterbio.com/blog/identify-define-your-cell-therapys-biomanufacturing-approach-for-critical-process-parameters-cpps (2021). Accessed.
- Lembong, J., Kirian, R., Takacs, J. D., Olsen, T. R., Lock, L. T., Rowley, J. A., & Ahsan, T. (2020). Bioreactor Parameters for Microcarrier-Based Human MSC Expansion under Xeno-Free Conditions in a Vertical-Wheel System. Bioengineering (Basel, Switzerland), 7(3), 73. https://doi.org/10.3390/bioengineering7030073
- Stephenson, M., & Grayson, W. (2018). Recent advances in bioreactors for cell-based therapies. F1000Research, 7, F1000 Faculty Rev-517. https://doi.org/10.12688/f1000research.12533.1
- Bartosh, T. J., Ylöstalo, J. H., Mohammadipoor, A., Bazhanov, N., Coble, K., Claypool, K., Lee, R. H., Choi, H., & Prockop, D. J. (2010). Aggregation of human mesenchymal stromal cells (MSCs) into 3D spheroids enhances their antiinflammatory properties. Proceedings of the National Academy of Sciences of the United States of America, 107(31), 13724–13729. https://doi.org/10.1073/pnas.1008117107
- Ferrari, C., Balandras, F., Guedon, E., Olmos, E., Chevalot, I. and Marc, A. (2012), Limiting cell aggregation during mesenchymal stem cell expansion on microcarriers. Biotechnol Progress, 28: 780-787. https://doi.org/10.1002/btpr.1527
- Rafiq, Q. A., Brosnan, K. M., Coopman, K., Nienow, A. W., & Hewitt, C. J. (2013). Culture of human mesenchymal stem cells on microcarriers in a 5 l stirred-tank bioreactor. Biotechnology letters, 35(8), 1233–1245. https://doi.org/10.1007/s10529-013-1211-9